
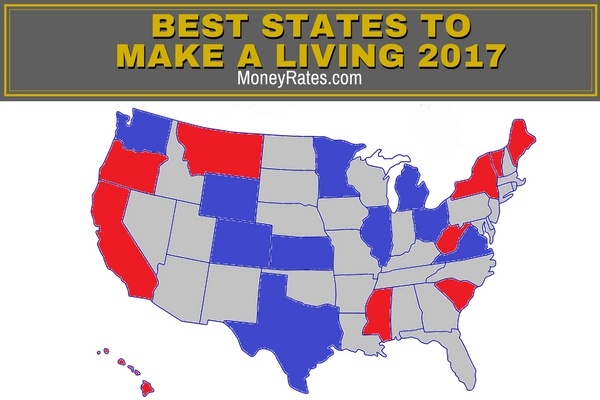
Best and Worst States to Make A Living 2017
- States like Washington, which do not have wage taxes, offer high wages but may have a higher cost of living.
- Higher-paying states, like Washington, also benefit from lower unemployment rates, providing a strong earning potential.
- Some states may have work-related health incidents higher than the national average, impacting overall quality of life.
This nation has come a long way since the Great Recession, but some state economies are coming ahead farther than others. Unemployment nationally is down below 5 percent, and wages are finally starting to rise.
However, some states are grappling with unemployment rates more than twice as high as in others. The highest-paying states have median wages that are about $15,000 above those of the lowest-paying states.
There are some areas where it’s not low wages that drag down the standard of living but expenses that drain savings accounts, as costs of living and/or state income tax rates are much higher than the national average. In still other cases, the risks are more tangible – a couple states have work-related health incident rates that are three times the national average.
All of these financial factors are especially important if you are thinking of moving to another state, or finding a way to jump-start your career. Are things likely to be tougher or easier if you relocate? To help you look before you leap, MoneyRates has assembled a list of the best and worst states to make a living
This list is based on the following factors:
- Cost of Living
- Workplace safety
- State tax burdens
- Median wages
- Unemployment rates
Based on a combination of the above five factors, these are the best and worst states to make a living in 2017.
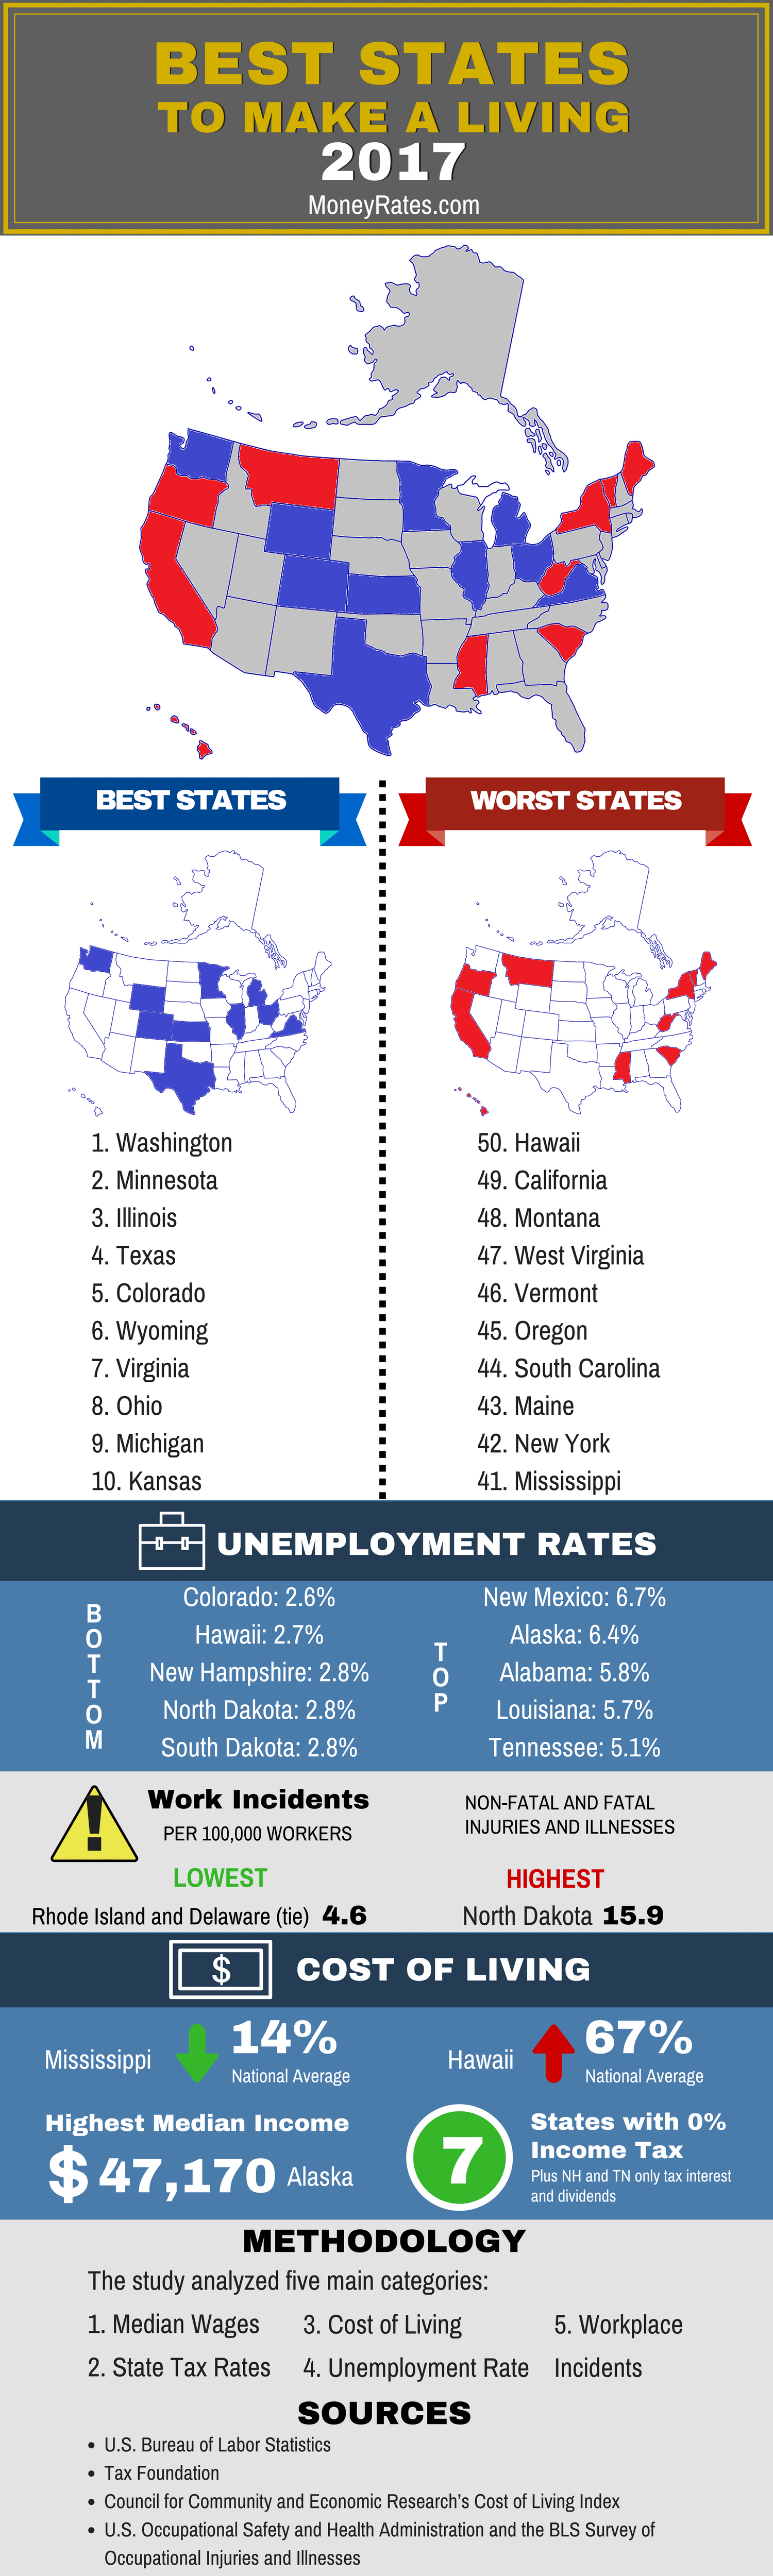
Best States to Make a Living 2017
1. Washington
This is one of nine states that does not levy a tax on wage income, and that is a particular advantage in Washington because the median wage there is the fourth-highest in the nation, putting more money in checking accounts. Washington is around the middle of the pack as far as the employment rate and workplace safety, so the only clear negative to be concerned with is the cost of living.
Living expenses are about 7 percent higher in Washington than in other states. While the high wage level would more than make up for that in most cases, be sure you have in-demand job skills so you don’t end up paying the high cost of living without a strong wage in return.
Finally, it is worth noting that Washington’s success in this year’s ranking is no flash in the pan. This is the seventh year MoneyRates has done this study, and Washington has finished first or second in each of those seven years.
2. Minnesota
The strongest attribute that Minnesota has going for it as a great place to make a living is a top-10 median wage level. Unemployment and rates of workplace safety incidents are also lower than in most states, meaning workers may have a relatively easy time finding a job, and have a relatively safe place to work once they find one.
The only real knock on Minnesota as a place to make a living is the state tax burden. As a percentage of median income, the state income tax burden is fifth-highest in the nation, which takes away some of the benefit of those high wage levels.
3. Illinois
Consistency is the key to Illinois ranking so high. The state was above median in four out of the five categories in this study, including ranking in a four-way tie for tenth place in workplace safety. The one category where Illinois fell down a bit was unemployment. Even in that case, its unemployment rate of 4.9 percent is not far below the average state rate of 4.3 percent.
4. Texas
Like Washington, Texas has been a perennial strong performer in this study. It has ranked in the top 10 for all seven years, including a No. 1 ranking in 2015. Also like Washington, workers in Texas benefit from paying no state income tax on their wages. Those wages go an especially long way in Texas because the cost of living is well below the national average.
However, if you are contemplating a move to Texas, it might be wise to have a job lined up because the unemployment rate in the state is tied for tenth highest nationally.
5. Colorado
This state boasts the lowest unemployment rate in the United States at just 2.6 percent. That kind of strong labor demand tends to boost wages, and Colorado’s median wage just missed the top 10, at No. 11. The only bad marks for this state were that Colorado is slightly worse than the median state for both affordability and tax burden.
6. Wyoming
A winner last year, Wyoming dropped this year largely because the measure of workplace safety was expanded to include both fatal and non-fatal incidents. This left Wyoming with the worst safety ranking in the country. However, if you are not in a risky profession, Wyoming is an attractive place to make a living.
The combination of an above-average median wage with a low cost of living and no state income tax means people in Wyoming can both earn well and see that money go a long way.
7. Virginia
Another consistent performer, Virginia has placed in the top 10 for all seven years of this study. This year, the state benefited from the fifth-best workplace safety record, and above-median rankings for median wage and employment. The one real downside is that the state’s income tax burden is higher than most.
8. Ohio
Though it is right around the middle of the pack for median wage, that money goes further in Ohio because both the cost of living and state income tax burdens are relatively low. This makes Ohio a good place to work if you have a job, but the one caveat is that getting a job there may not be as easy as in most states. Ohio’s unemployment rate of 5.1 percent is tied for fifth-worst nationally.
9. Michigan
It’s interesting that two huge college football rivals, Ohio and Michigan, should have such a close finish in this study, and their characteristics are fairly similar. The biggest difference was Michigan’s higher state tax rates landed it below Ohio in the overall ranking.
10. Kansas
Affordability is a big strength of Kansas as a place to make a living, as it has the eighth-lowest cost of living of any state. States with low costs of living sometimes have struggling economies, but that does not appear to be the case in Kansas because the unemployment rate of 3.8 percent is below the national average.
Which Banks Have the Best CD Rates?
Most banks offer CDs, and there’s fierce competition among them to offer the best rates. Use our MoneyRates CD rate-finder tool below to sort through the list to find a CD that fits your financial goals.
Rates Updated on July 15, 2026
Worst States to Make a Living 2017
1. Hawaii
While this study has had five different winners in seven years, Hawaii has finished dead last each time. Why is such a popular vacation spot such a bad place for making a living?
It really comes down to workers not getting much out of their paychecks because of a high cost of living and high taxes. While Hawaii has the tenth-highest median wage of any state, that is not enough to compensate for living expenses that are about two-thirds higher than in the rest of the nation. That problem is compounded by the third highest state income tax burden.
On the bright side, the unemployment rate in Hawaii is the second lowest in the U.S. One would expect that in time, that degree of labor demand would drive wages higher, allowing them to do a better job of adjusting for the high cost of living in Hawaii.
2. California
The challenges in California are similar to those in Hawaii – a fairly high median wage is devalued by a high cost of living (California’s is second only to Hawaii’s) and high state income taxes. While California’s cost of living problem is not as acute as Hawaii’s, its unemployment rate is more than 2 percent higher.
3. Montana
The two biggest issues with making a living in Montana are workplace safety and low wages. Based on a combination of workplace fatality rates and occupational-related injury and illness, Montana’s working environments are the third riskiest in the nation. At the same time, workers in the state don’t get paid well for that risk, since the median salary is in the bottom 10.
4. West Virginia
As with Montana, the problem in West Virginia stems from a combination of low wages and dangerous working environments. West Virginia has the third-lowest median wage, and workplace safety is among the 10 worst.
5. Vermont
With one of the 10 lowest unemployment rates in the nation, Vermont is a fairly easy place to find a job, but nonetheless making a living is tough due to one of the 10 highest costs of living. Median wages are just slightly higher than the middle of the pack, so they don’t do enough to make up for that cost of living.
6. Oregon
The most prominent thing dragging Oregon down is the highest burden of state taxes on wages of any of the 50 states. Adding to the expense of working in Oregon, the cost of living generally is higher than the norm.
7. South Carolina
Average wages, state income tax, and workplace safety are all among the 10 worst. As a result, it is no surprise to see that South Carolina landed among the 10 worst states for making a living overall.
8. Maine
Maine’s so-so median wage level is eroded by a higher-than average cost of living, and it has one of the highest state income tax burdens.
9. New York
The median income may be the sixth highest, but this is not enough to compensate for New York’s cost of living and state income taxes that are both among the 10 most expensive in the nation.
10. Mississippi
The good news is this is the cheapest state to live in, but workers there still can’t afford much because it also has the lowest median wage. Workplace safety also ranks as one of the worst.
The differences between the best and worst states for making a living are wide enough that they could meaningfully impact your career and your long-term finances. Think about the above lists the next time you consider what a fresh start somewhere else might do for your future.
Full Ranking of All 50 States
**Data was not available for these states for non-fatal work-related injuries and illnesses, per equivalent of 100 full-time workers so the average of all other states was used.
Best and Worst States to Make a Living Infographic
Methodology and Sources
Here are the five factors we evaluated and the data sources we used:
1. Median wages
Median annual wage data is from the U.S. Bureau of Labor Statistics.
2. State tax rates
MoneyRates analyzed the state tax information collected by the research group Tax Foundation.
3. Cost of living
Data was gathered from the Council for Community and Economic Research’s Cost of Living Index.
4. The unemployment rate
Unemployment data was sourced from the BLS.
5. Incidents of workplace illness, injuries and fatalities
Workplace safety data (fatal and non-fatal incidents) is from the BLS, which sourced data from employer reports to the U.S. Occupational Safety and Health Administration and the BLS Survey of Occupational Injuries and Illnesses.